
Theories of Demand and Supply
- The tools of demand and supply can take us far in understanding not only specific economic issues but also how the entire economy works.
- As you recall, the circular flow model in your Grade 9 course identified the participants in the product and resource markets.
- There, we asserted that prices were determined by the interaction between demand and supply in these markets.
- In this unit we examine that interaction in detail, explaining how prices and output quantities are determined, and the determinants and elasticities of demand and supply.
Thus, the market means the system in which sellers and buyers of a commodity interact to settle its price and the quantity to be bought and sold.
- Explain the theory of demand.
- Describe the theory of supply.
- Identify factors that affect demand and supply.
- Distinguish between individual and market demand.
- Distinguish between individual and market supply.
- Demonstrate market equilibrium both graphically and mathematically.
- Evaluate the effect of changes in demand and supply on equilibrium price and quantity.
- Define elasticity.
- Calculate and interpret the different types of elasticity.
- Define the concept of demand.
- State factors affecting demand.
- Explain demand schedule and demand curve.
- Interpret demand equations and the slope of a demand curve.
- Distinguish between changes in demand and changes in quantity demanded.
- Determine individual and market demand.
- In the previous unit, we studied and derived the consumer’s optimum given income, the price of the goods and preferences.
- The demand for a commodity is the quantity that consumers are able and willing to buy at various prices during a given period of time.
Demand can be expressed in the form of schedules, functions or curves.
- Qd is the quantity demanded.
- P is the price.
- a is a constant.
- b is the coefficient of price (it gives the slope).
- Because quantity is a function of price, these variables can be put in tabular form (a schedule) and transformed into curves.
- Let us consider the relationship between the price of coffee and the quantity of coffee demanded, using a hypothetical example.
- Table 2.1 shows how many kilograms of coffee Amina buys each month at different prices per kilogram.
- If coffee is free (the price is zero), she buys 9 kg.
- At Birr 5, she buys 8 kg.
- As the price rises further, she buys fewer and fewer kilograms.
- When the price reaches Birr 45, Amina does not buy any coffee at all.
| Price of coffee (Birr per kg) | Quantity demanded (kg) |
|---|---|
| 0 | 9 |
| 5 | 8 |
| 10 | 7 |
| 15 | 6 |
| 20 | 5 |
| 25 | 4 |
| 30 | 3 |
| 35 | 2 |
| 40 | 1 |
| 45 | 0 |
Table 2.1: Amina’s demand schedule – the quantity demanded at each price.
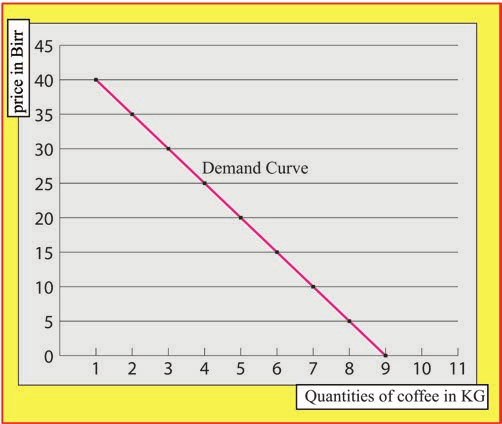
- The demand curve in Figure 2.1 graphs the demand schedule in Table 2.1.
Read the full notes for all 4 sections, worked examples and figures, plus 15 exercises with step-by-step solutions, the Short Note and the unit review.
📑 Contents
- 2.1Theory of DemandPreview
- 2.2Theory of Supply🔒
- 2.3Market Equilibrium🔒
- 2.4Elasticities of Demand and Supply🔒
✍️ Practice questions
5 questions from the Unit 2 quiz. Choose an answer, then check it.
- 1
Demand for a commodity requires both:
- AHigh income and low price
- BGovernment approval and subsidy
- CWillingness to buy and ability to pay
- DAdvertising and branding
Show answer
C Willingness to buy and ability to pay
- 2
A demand schedule is best described as:
- AA table showing quantities demanded at different prices
- BA graph of price against cost
- CA record of a firm's total revenue
- DA list of substitute goods
Show answer
A A table showing quantities demanded at different prices
- 3
The demand function Qd = a − bP shows that quantity demanded is:
- AEqual to price
- BUnrelated to price
- CDirectly related to price
- DInversely related to price
Show answer
D Inversely related to price
- 4
The law of demand states that, all else constant:
- AQuantity demanded rises as price falls
- BPrice and quantity demanded are unrelated
- CQuantity demanded falls as price falls
- DQuantity demanded rises as price rises
Show answer
A Quantity demanded rises as price falls
- 5
Which of the following is NOT listed as a factor affecting demand?
- AConsumer income
- BTastes and habits
- CCost of factors of production
- DPopulation size
Show answer
C Cost of factors of production