
Statistics and Probability
- Everybody collects, interprets and uses information, and much of it is in numerical or statistical form.
- People receive large amounts of information every day through conversations, television, computers, radio, newspapers, posters and notices, so they need to be able to select, compare and reject it.
- In business and government, statistics provides a description of the present, a profile of the past and an estimate of the future, to help in making decisions.
A statistical investigation is a systematic activity: collecting data about a group of people or objects, organizing and describing the data, analyzing it with statistical methods, and using the results to make judgments, decisions and predictions.
- Collect and represent simple statistical data using different methods such as histograms.
- Use facts and basic principles of probability.
- Develop the concept of probability via experimentation and hypothetical events.
Statistics is the science of collecting, organizing, presenting, analyzing and interpreting data so that one can make a generalization.
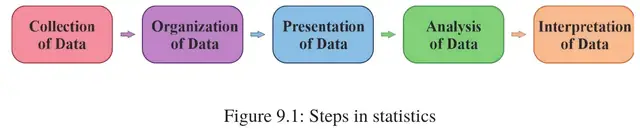
- Data collection is the process of gathering information from all the relevant sources to answer a question.
- Data can be qualitative or quantitative.
- Qualitative data describes characteristics whose values are not numbers, such as colour, sex, religion or the town a person lives in.
- Quantitative data is numerical, such as exam scores, height, weight, age or wealth; statistics deals mainly with quantitative data.
- Continuous data can be measured on a scale and can be divided into finer and finer levels, such as height in metres, centimetres and millimetres, or temperature and time.
- Discrete data is a count, usually whole numbers, such as the number of children in a school (some discrete data, like shoe sizes, come in halves).
- Primary data is generated by the researcher through surveys, interviews, experiments or direct observation.
- Secondary data was produced earlier by others, for example records of government institutions or health facilities.
- Interviews (in-depth or focus group), direct observation and questionnaires are common ways of collecting data.
- Tabulation is the organization of data into a statistical table of rows and columns.
- Data is presented with graphs and diagrams such as bar graphs, histograms, pie charts and pictograms, then analyzed with representative values (mean, median, mode) and measures of spread, and finally interpreted to draw conclusions.
Read the full notes for all 2 sections, worked examples and figures, plus 23 exercises with step-by-step solutions, the Short Note and the unit review.
📑 Contents
- 9.1Statistical DataPreview
- 9.2Probability🔒
✍️ Practice questions
5 questions from the Unit 9 quiz. Choose an answer, then check it.
- 1
Statistics is best defined as the science of:
- ACollecting, organizing, presenting, analyzing, and interpreting data
- BOnly calculating averages
- COnly making graphs
- DOnly collecting numbers
Show answer
A Collecting, organizing, presenting, analyzing, and interpreting data
- 2
A characteristic or attribute of an individual that can be measured or observed and varies among subjects is called a:
- AConstant
- BSample
- CVariable
- DParameter
Show answer
C Variable
- 3
A graphical representation of a frequency distribution, with the variable on the x-axis and frequency on the y-axis, is called a:
- APie chart
- BScatter plot
- CLine graph
- DHistogram
Show answer
D Histogram
- 4
Unlike a bar chart, the bars of a histogram:
- AAre always separated by gaps
- BRepresent categorical, non-numeric data
- CTouch one another (since classes are continuous)
- DAre always the same height
Show answer
C Touch one another (since classes are continuous)
- 5
The arithmetic mean of a data set is calculated as:
- AThe difference between highest and lowest values
- BThe middle value when sorted
- CThe most frequently occurring value
- DThe sum of all values divided by the number of values
Show answer
D The sum of all values divided by the number of values